Figure upscale

Re-render a low-resolution figure at a printable pixel density

Journals ask for 600 dpi line art and 300 dpi halftones, and the figure an author actually has is often a schematic pulled out of a slide deck or lifted from a PDF — a few hundred pixels wide, soft at every edge, and enough on its own for the editorial office to send the manuscript back before review. Sign in, upload that figure, and pick a target density: the model redraws it at the larger size, reconstructing strokes and type as clean marks instead of smoothing them. Read the next section before you use it, though — this is a generative redraw, not an interpolation, and there is a class of figure it must never touch.

Přidat referenční obrázekMaximálně 1

Předvolby

Zobrazit celý prompt

Po přihlášení můžete nahrát referenční obrázek a vytvořit nový obrázek na jeho základě.

Generování vyžaduje přihlášení – nejprve napište prompt a poté se přihlaste a generujte.

Multiple AI models

GPT Image 2, Nano Banana, Seedream 5, Flux 2 Pro and more — pick the right one per figure.

Up to 4K export

Render at 1K, 2K or 4K for print-ready manuscript output.

Text & sketch to figure

Start from a prompt, or refine a rough hand-drawn sketch.

Free to start

Free account in seconds — every figure is saved to your private history.

Figure upscale

Before and after, on the only class of figure this tool may touch

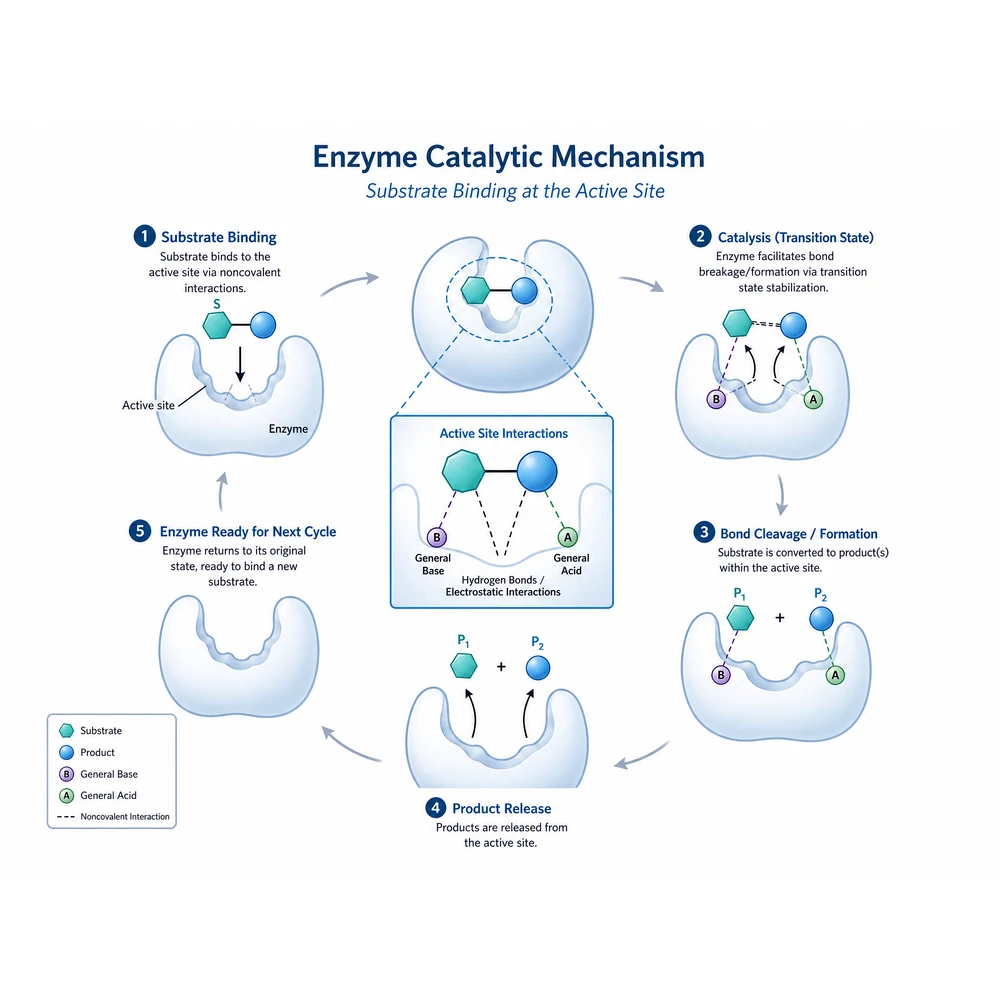
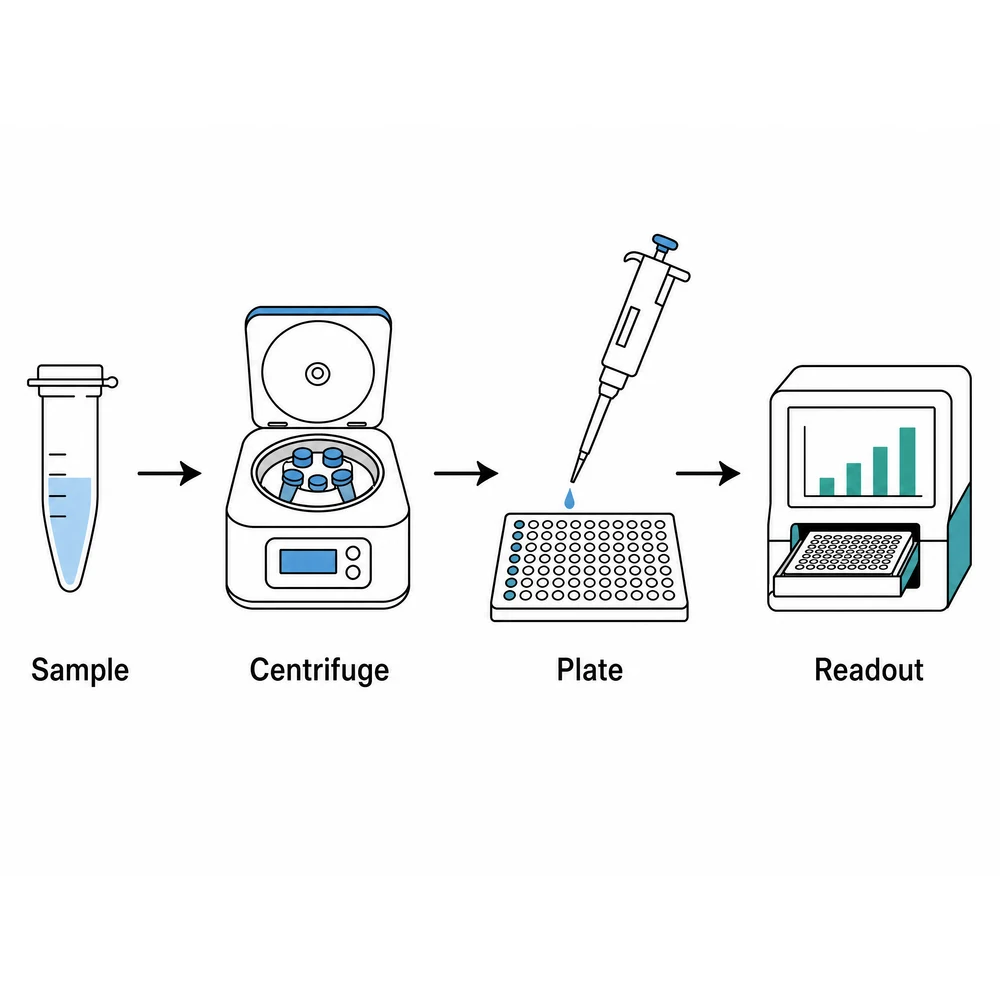
One workflow schematic, run through the 4K cell. Both images are shown at the same display size, so what changes is the density, not the framing. Every example here is an illustration — a drawn diagram — because a drawn diagram is the only thing a generative redraw may be pointed at.

Upscale workflow

Re-render at a higher density, then check what the redraw invented

The same four-step workflow schematic re-rendered with continuous outlines and sharp labels1

Upload the low-resolution figure you already have

This is an image-to-image tool: sign in, then upload one file — a schematic recovered from a slide deck, a panel exported out of a published PDF, or a diagram whose source file is long gone. One image per run, and there is no free-text box, so the upload and the tier you pick are the entire request. Start from the largest copy you can find. The model rebuilds what it can read, and a label that is unreadable in the input is a label it will have to guess at in the output.

  • One image per run
  • Use the largest copy you can find, not a screenshot of a screenshot
  • Crop stray margins first so the redraw spends its pixels on content
  • Keep the original file — you will need it to check the result
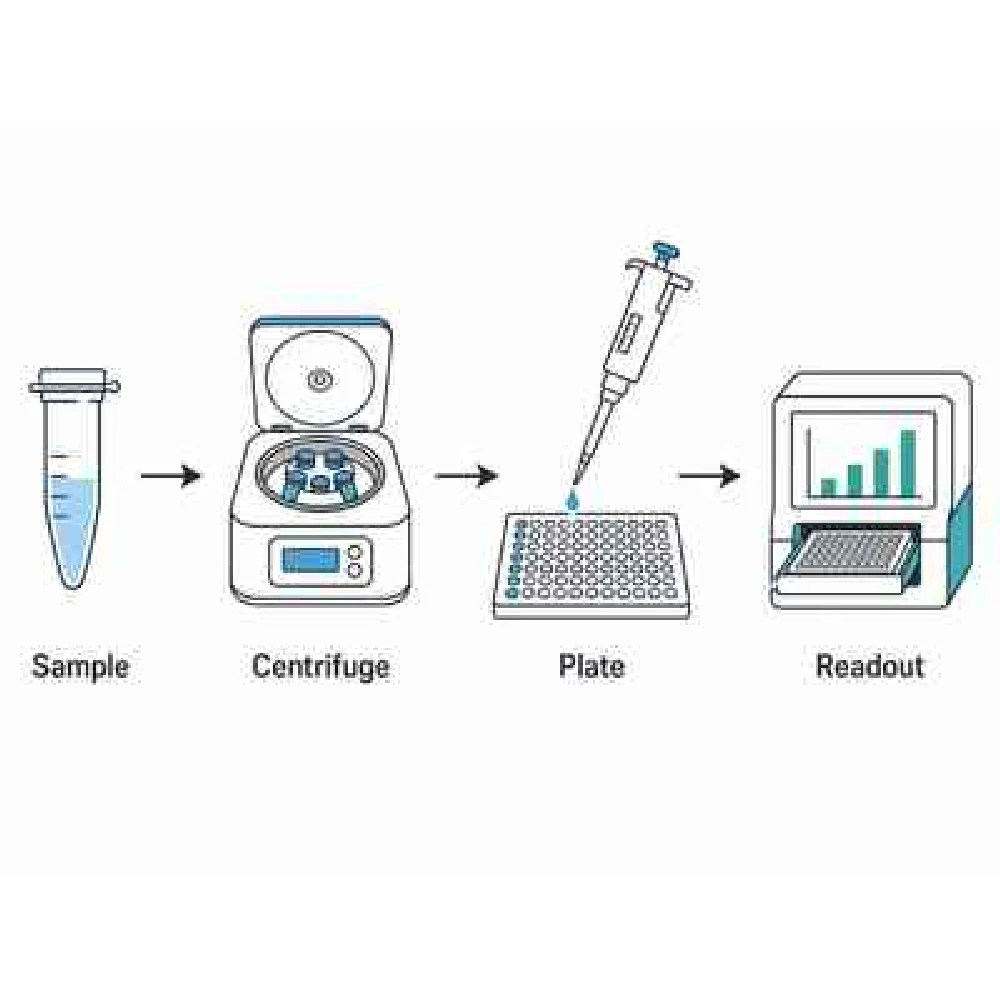
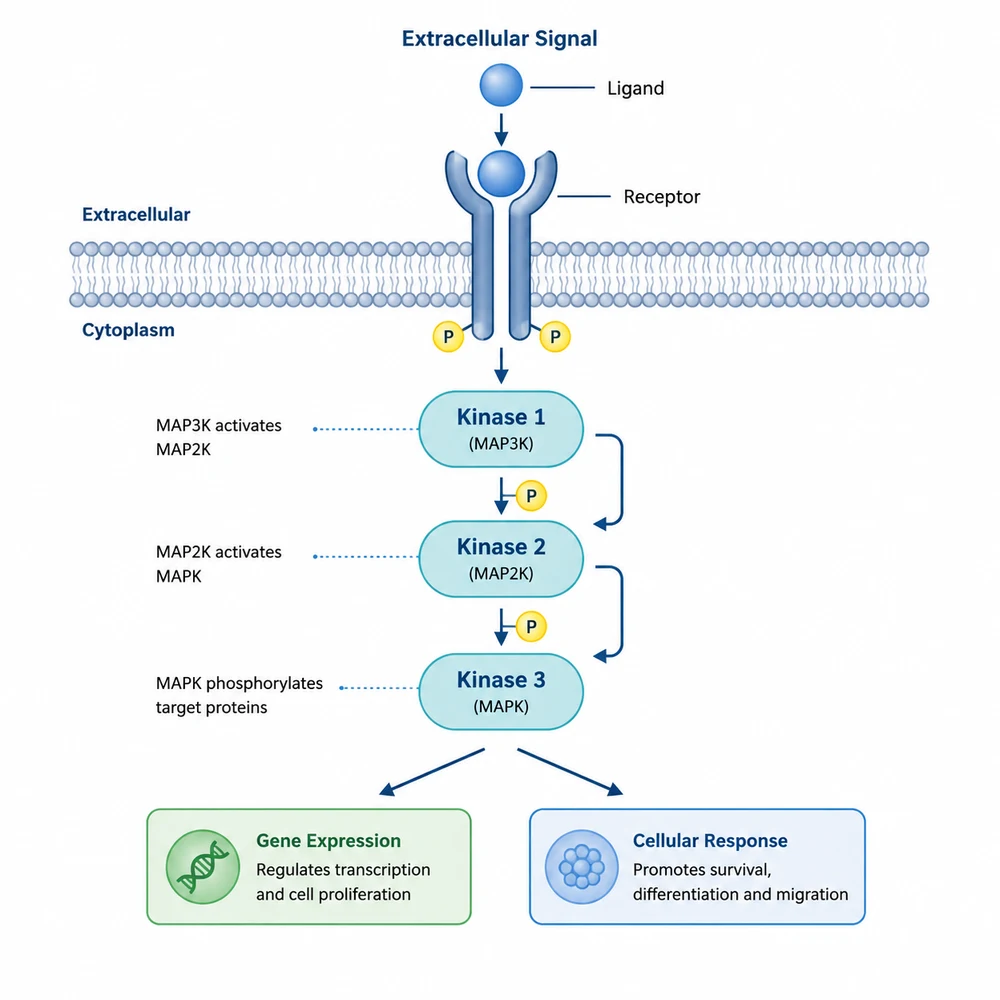
A four-step workflow schematic at low resolution, with soft edges and compression artefacts around the labels2

Two cells, two prices: 2K costs 180 credits, 4K costs 250

Neither cell writes a word into the prompt. Each one writes a resolution into the generator parameter, which is why the instruction is identical in both cases. 2K is the starting tier and covers on-screen review, slides and preprint PDFs. 4K is the tier to pick when the figure is headed for a print submission at the 300 dpi journals ask for. Because the two tiers are priced differently, clicking a cell changes what the run costs — the summary line beside Generate always quotes the price for the current selection, and it is worth reading, because the two cells look identical apart from their labels. 1K is deliberately not offered: it is the tier most low-resolution inputs are already at, so the cell would charge you to hand back what you uploaded.

  • 2K — screen, slides, preprint PDFs — 180 credits
  • 4K — print submission at the 300 dpi journals ask for — 250 credits
  • The price follows the cell you click; read the summary line before you generate
  • No 1K cell, because it would return the input tier for a full charge
The same four-step workflow schematic re-rendered with continuous outlines and sharp labels3

This is a generative redraw, not an interpolated upscale — never point it at data

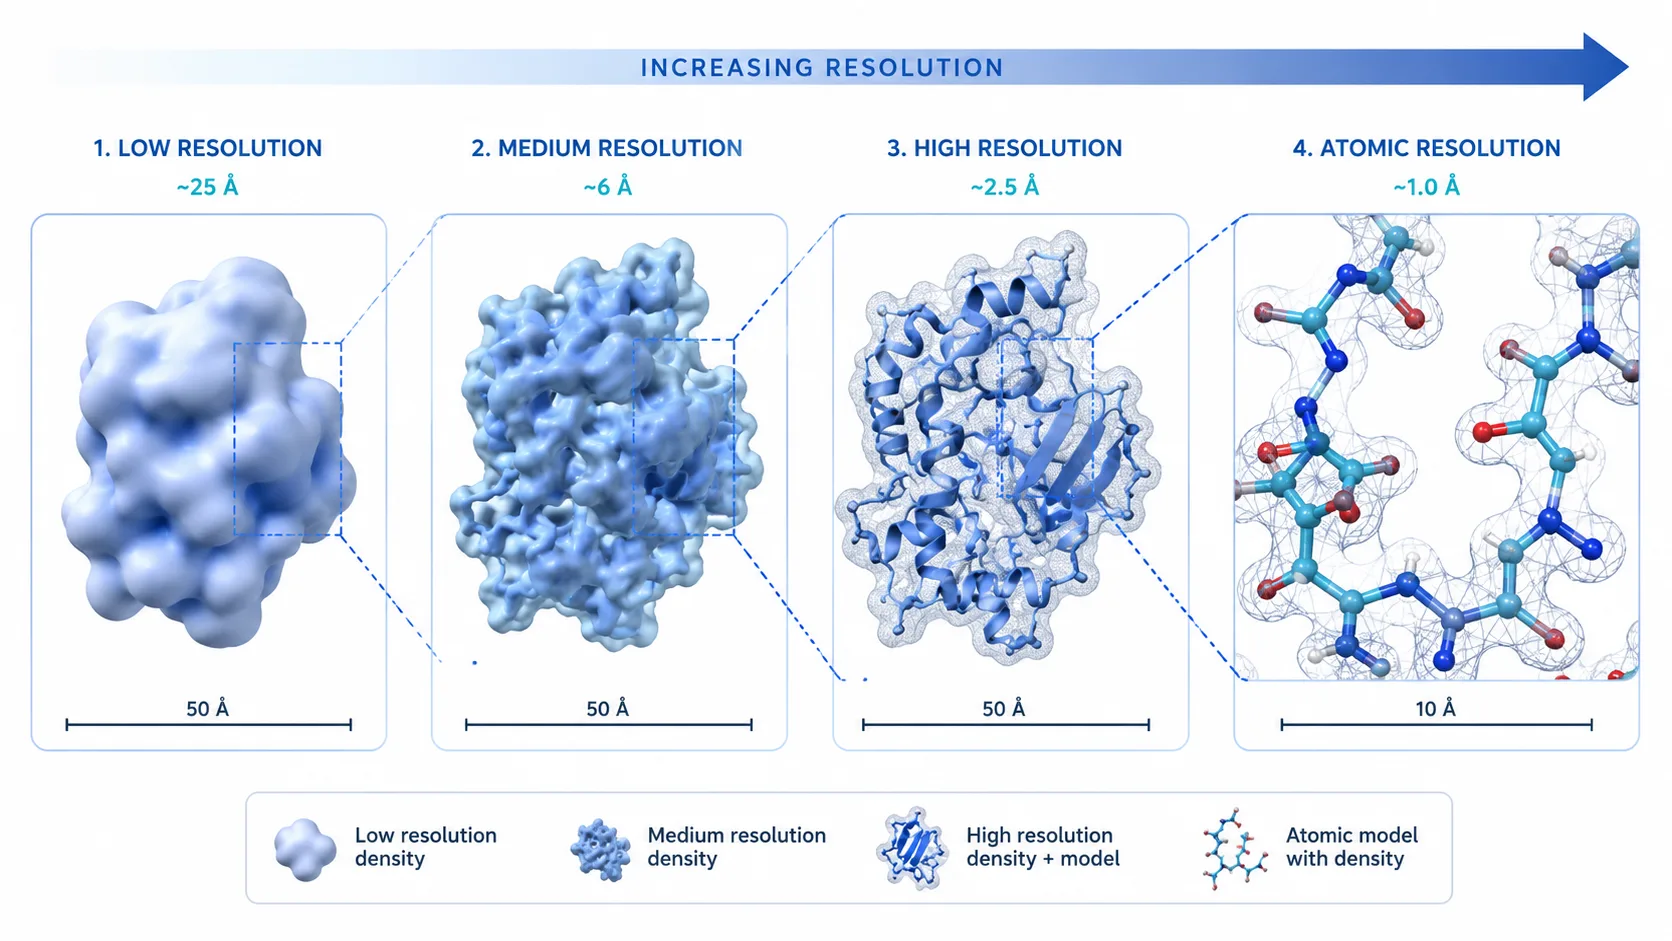
A conventional upscaler interpolates: it computes new pixels from the ones already present, and every pixel it emits is traceable back to the input. This tool does something categorically different. It asks an image model to draw the figure again at the larger size, and the model reconstructs edges, strokes and characters from what it takes the figure to show. The result usually looks better than an interpolation — continuous outlines, sharp legible type — precisely because it is not derived from the original pixels. Enlarged detail here is generated detail. That makes the tool unsuitable, and in a submission context actively dangerous, on anything that is raw experimental data: micrographs, gels and blots, flow cytometry plots, radiological and other clinical scans. Pushing one of those through a generative model yields an image in which structures are drawn rather than measured, which is fabrication of data regardless of what was intended. Use this tool on the class of figure that was drawn in the first place: schematics, pathway and mechanism diagrams, graphical abstracts, flowcharts, apparatus drawings and comparable illustrations.

  • Suitable: schematics, pathway and mechanism diagrams, graphical abstracts, flowcharts, apparatus drawings
  • Never: micrographs, gels and blots, flow cytometry plots, radiological and clinical images, or any panel that is itself a measurement
  • The output pixels are not an enlargement of the input pixels — they are drawn anew
  • If the upscaled figure goes into a submission, state the AI processing in the figure legend or the methods
A four-step workflow schematic at low resolution, with soft edges and compression artefacts around the labels4

Read every label before you use the result

Text is where a redraw fails most visibly. The instruction requires every character to come back spelled exactly as in the input, and forbids adding, removing, rewording, moving or resizing anything — but it is still an image model, and a character it could not read in a soft source is a character it will render as a plausible guess. A subscript, a unit, a gene name, a p-value. Put input and output side by side at full zoom and read the output as text rather than looking at it as a picture. Check the numbers on every axis, every legend entry, the direction of every arrow, and the panel letters. Where the guess is wrong, correct that label in an image editor instead of re-running and hoping the next draw reads it properly.

  • Read the output at full zoom, label by label, against the original
  • Watch subscripts, superscripts, units and Greek characters especially
  • Confirm arrow directions, panel letters and legend entries are unchanged
  • Confirm nothing was added, removed or restyled along the way
The same four-step workflow schematic re-rendered with continuous outlines and sharp labels5

2K and 4K name a tier, not a dpi — do the arithmetic

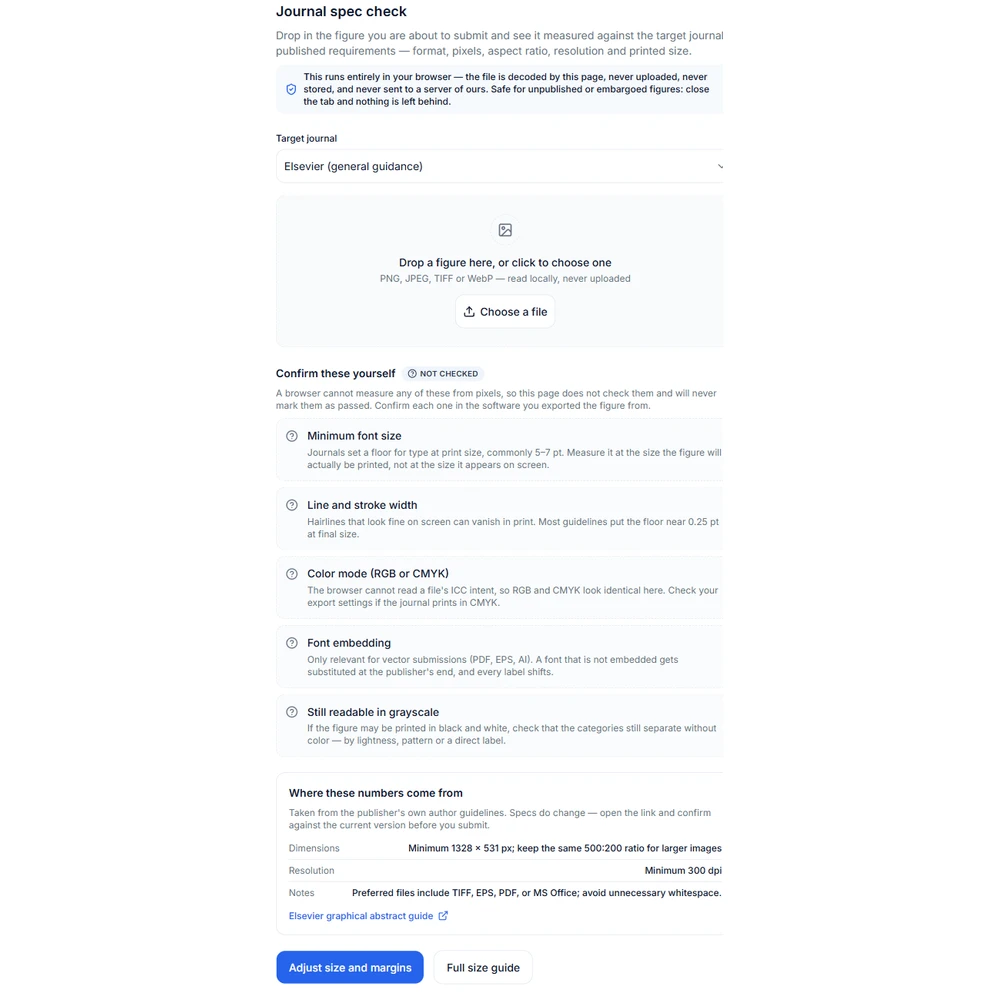
Journals state a density, not a pixel count: typically 300 dpi for halftone and combination figures, and 600 dpi (occasionally 1200) for line art. Density only exists once a printed width is fixed, so the tier you pick here does not answer the requirement by itself. Take the pixel dimensions of the file you download, divide by the width the figure will actually be printed at — roughly 3.3 inches for a single column, 6.7 to 7 inches for a full-width figure — and compare that number against what the journal asks for. In practice 4K at single-column width clears 600 dpi with room to spare, while 2K dropped into a full-width slot may not reach 300; do the division on the real file rather than trusting the tier name. When the final file is ready, run it through /figure-spec-check to confirm dimensions, density and format against the target journal before submitting.

  • dpi = pixel width divided by printed width in inches
  • Line art usually needs 600 dpi; halftone and combination figures usually 300
  • Set the dpi tag at export — the tag by itself does not add pixels
  • Verify the delivered file at /figure-spec-check

Generated detail is not recovered detail — declare the processing

This tool re-renders your figure with an image model. It does not recover information the low-resolution input never carried; it produces plausible detail in its place, so the enlarged pixels are drawn by the model rather than derived from your original. Use it only on illustrative figures — schematics, pathway diagrams, graphical abstracts, flowcharts — and never on micrographs, gels, flow cytometry plots, clinical scans or any other panel carrying raw experimental data, where a generative redraw would amount to fabricating results. Verify every label and element against the original before use, retain the unprocessed file and the source data, and where the upscaled figure appears in a submission or a publication, state in the figure legend or the methods that it was processed with an AI image model. Most journals require exactly that disclosure for any image processing.

Figure upscale questions

Upscale a figure

Sign in, upload the low-resolution illustration you already have, and re-render it at 2K or 4K — on schematics and diagrams only, never on raw data.