
Left-to-right workflow
- Best for
- Experimental pipelines, synthesis, interventions
- Suggested structure
- Input -> method -> measured outcome
- What to verify
- Arrow direction, sample order, controls, labels, and causal wording
Visual pattern library
The strongest graphical abstracts make one claim easy to understand at a glance. Use these patterns as composition references, then rebuild the details around your own evidence and target journal.
A good example is not a picture to copy. It shows how to compress a research question, method, mechanism, and outcome into a clear reading path while preserving scientific accuracy, legibility, and journal compliance.
These AI-generated images illustrate reading paths and hierarchy only. They are not publisher-approved templates or submission-ready scientific figures.
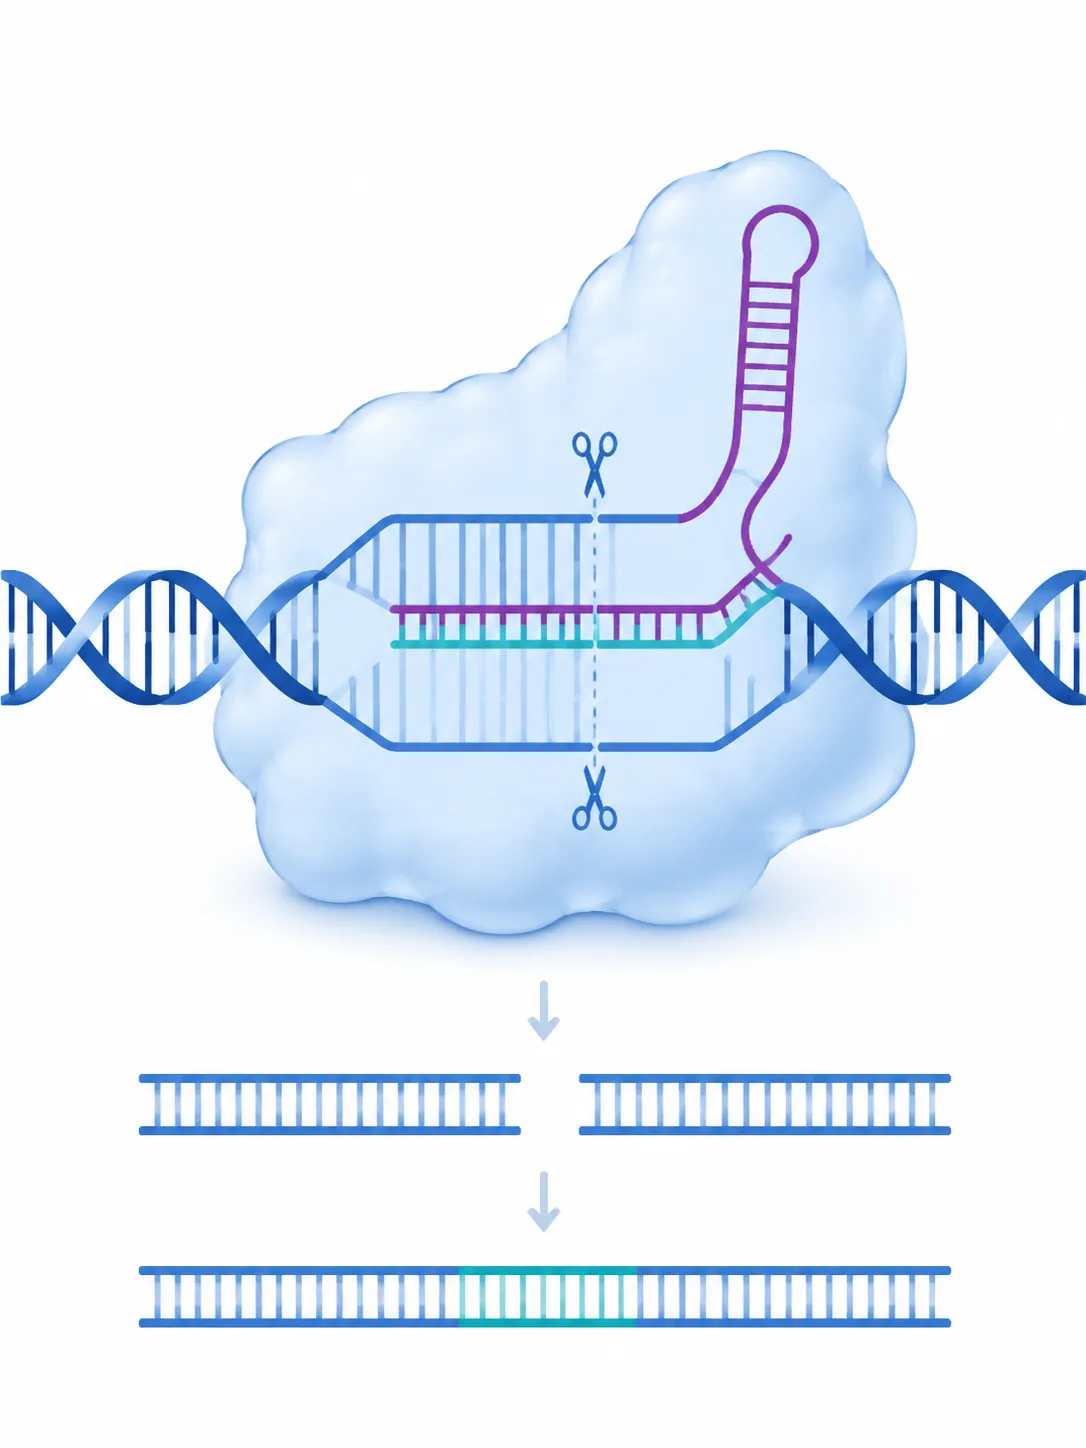
Single-panel CRISPR workflow with a left-to-right reading path: verified target DNA, guide RNA complex, cleavage site, and repair outcome; minimal labels, clear arrows, white background
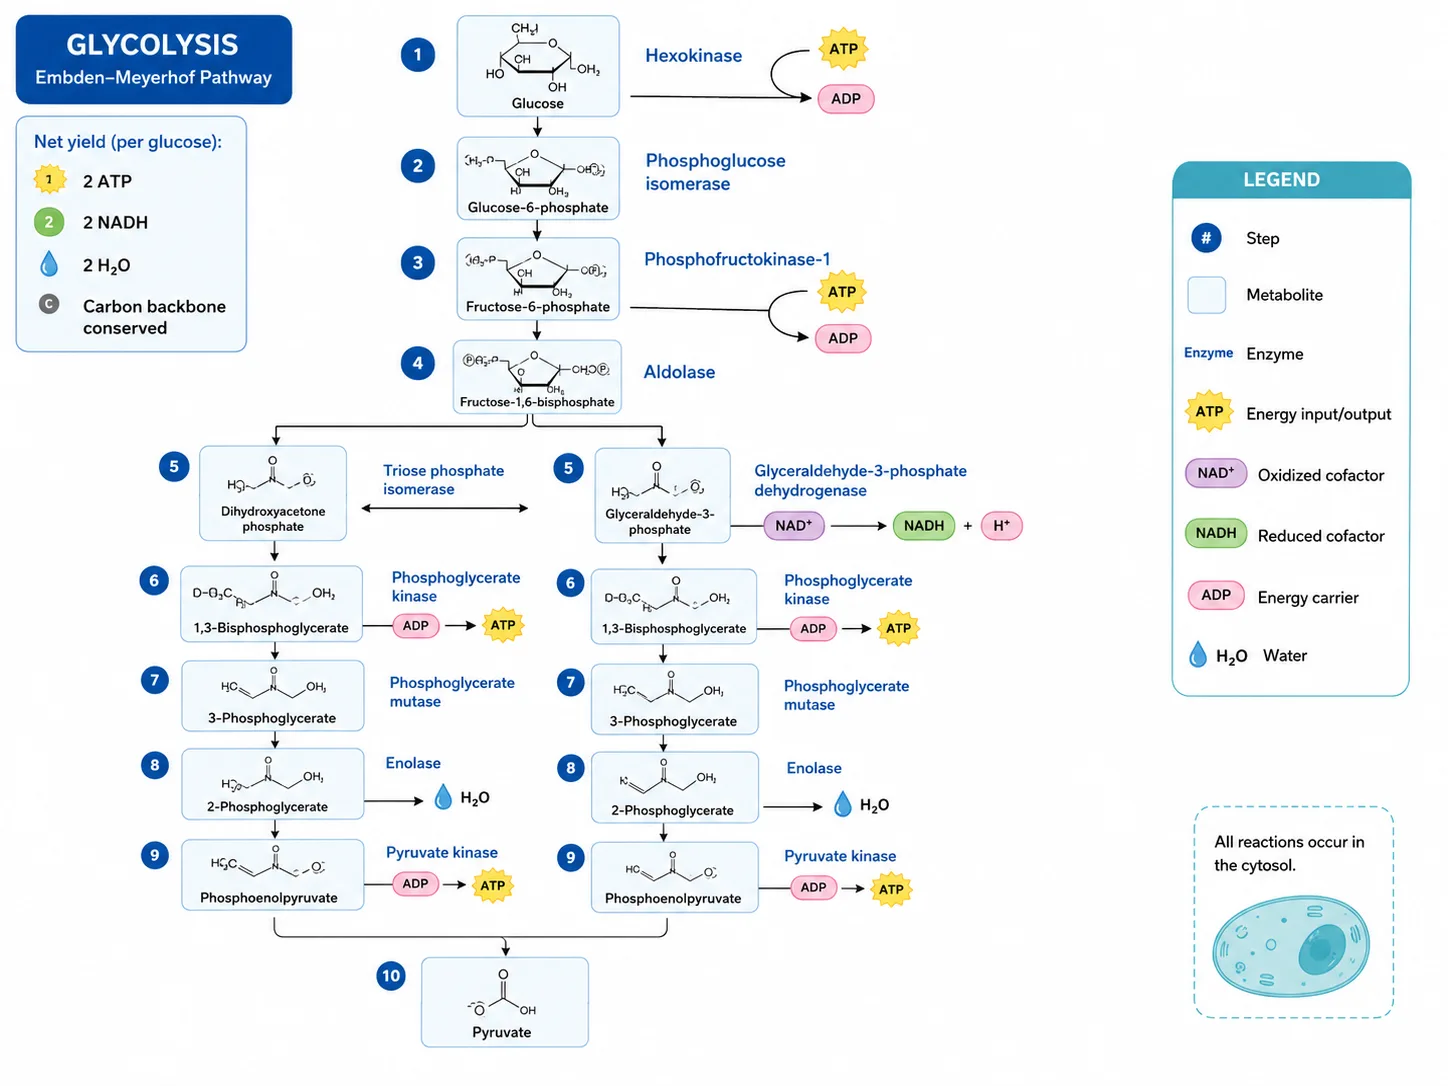
Single-panel metabolic pathway overview with verified metabolites and enzymes in reaction order, branches aligned consistently, inputs and outputs distinguished, compact legend, white background
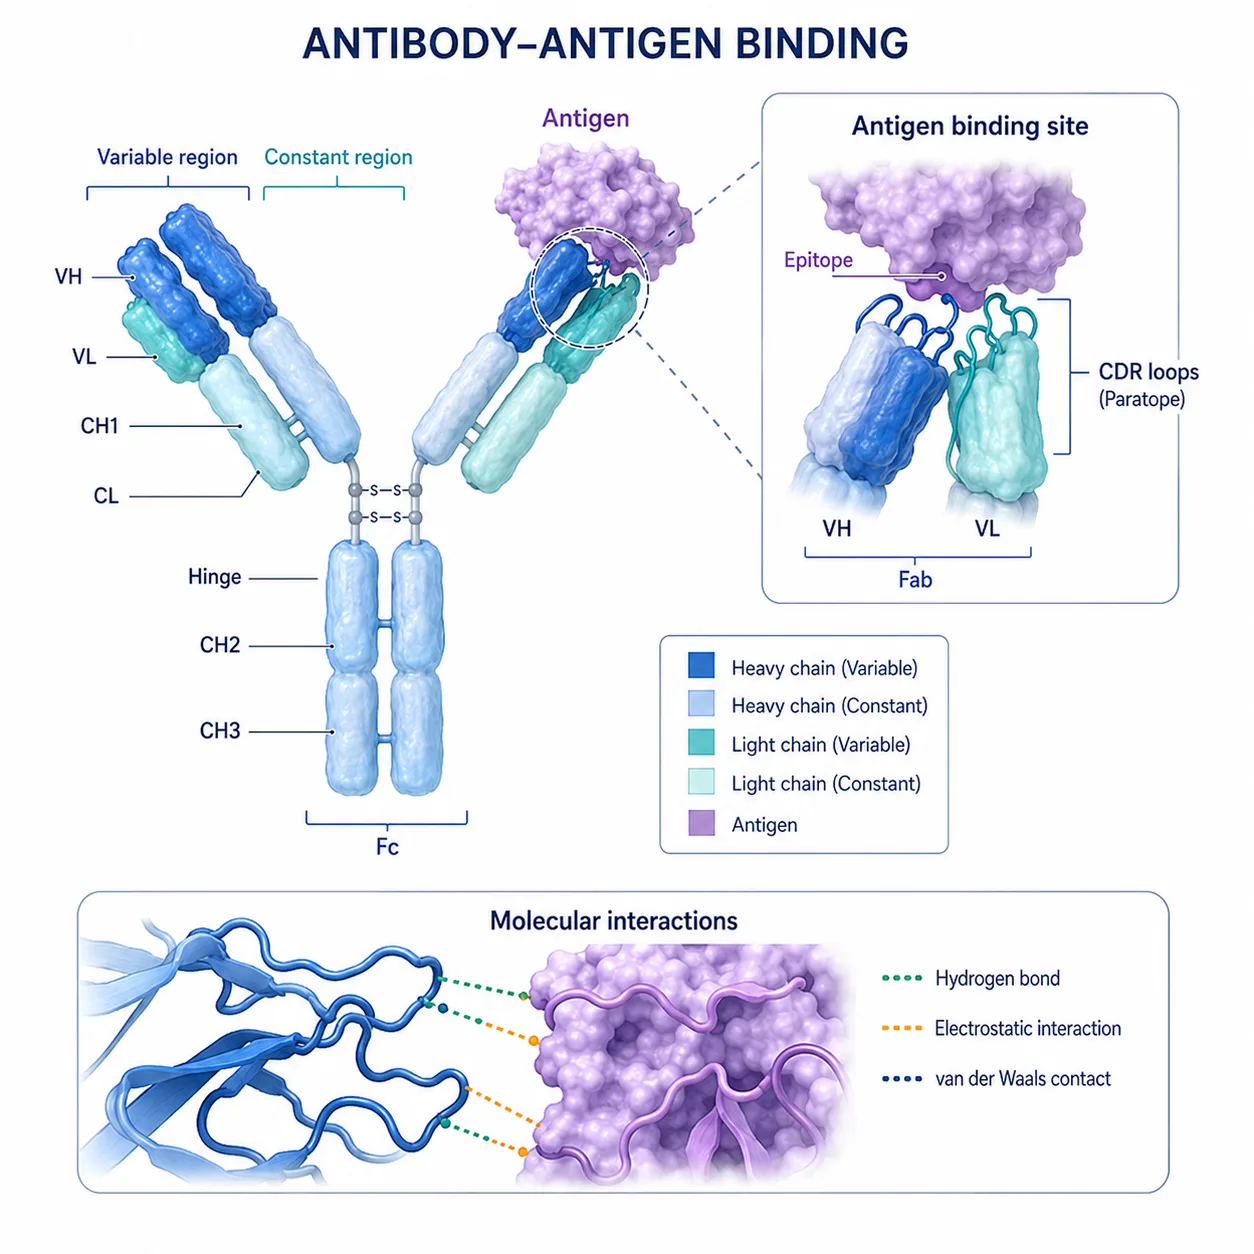
Single-panel antibody-antigen interaction overview with the full complex on the left and one enlarged verified binding interface on the right; concise labels, restrained color key, white background
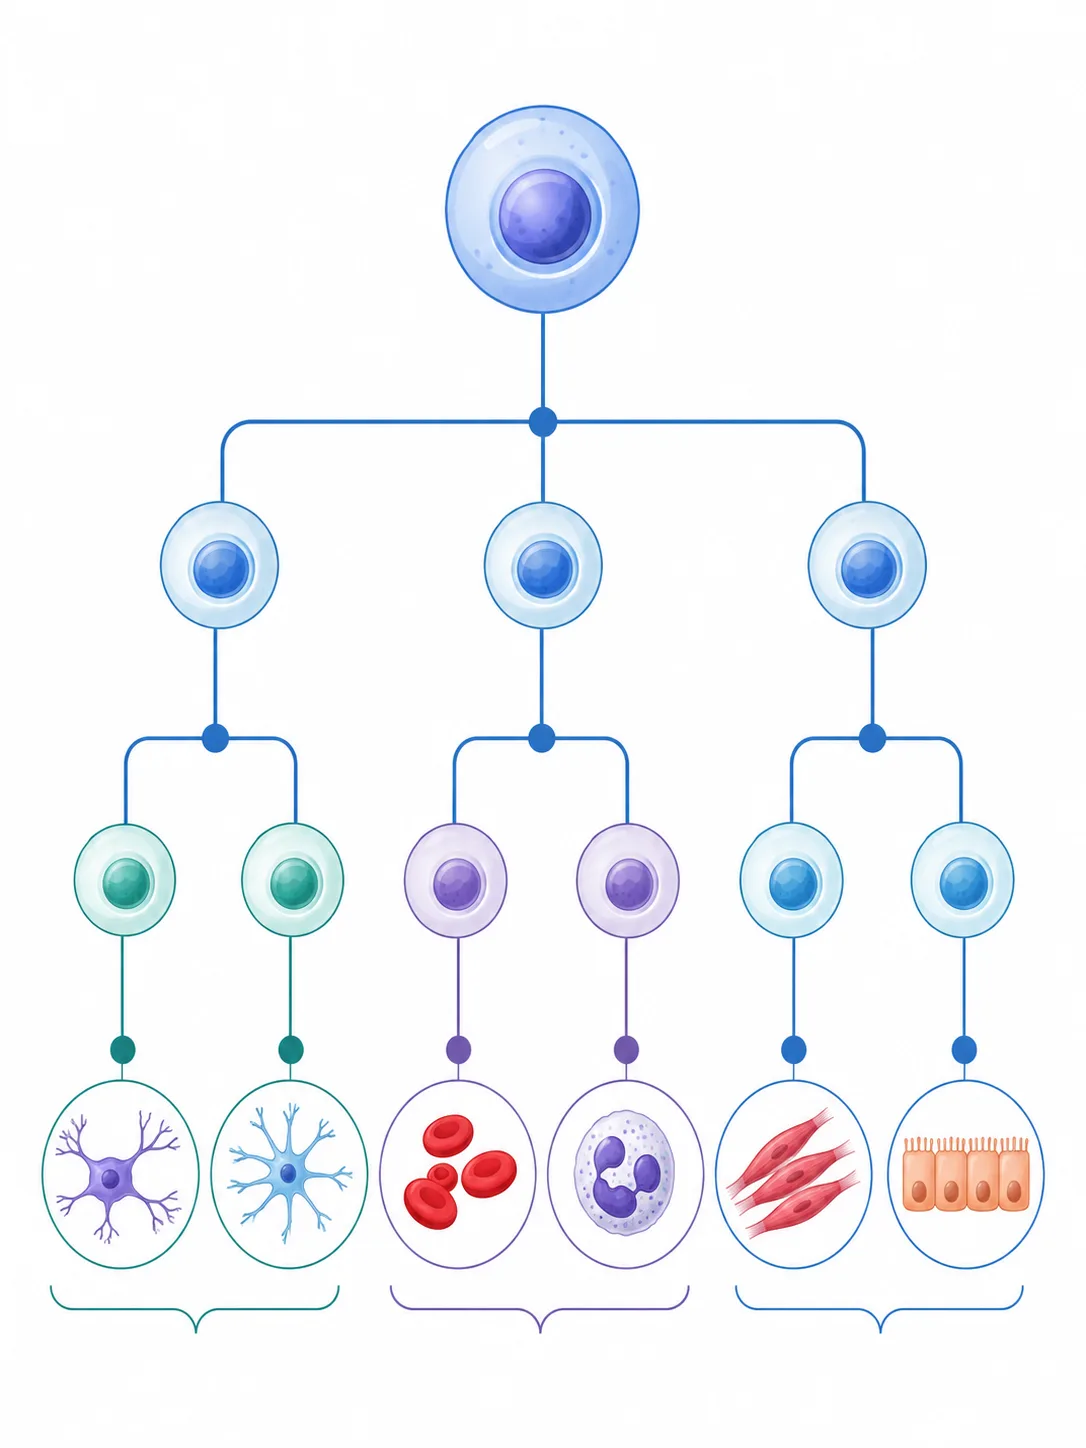
Single-panel stem cell differentiation hierarchy with one starting cell, clearly separated verified branches, consistent node spacing, distinct endpoint cell types, minimal labels, white background
On this page
Choose the pattern that matches the logic of the paper. The images below are composition references, not submission templates. Official references explain general or publisher-specific requirements; they do not approve any SciFig-generated example for submission.
Official policies and technical requirements can change. Review the exact journal's current guide for authors and AI policy immediately before submission; that guidance overrides this page.
Before choosing colors or icons, write one sentence containing the system, intervention or method, and main supported outcome. Every visual element should help communicate that sentence. Background facts, secondary assays, and speculative mechanisms usually belong in the paper rather than the graphical abstract.
For a workflow, describe the stages, reading direction, and visual hierarchy. For a mechanism, list the verified entities, compartments, and relationship types. For a comparison, define both conditions and the measured difference. Do not include confidential manuscript text, patient data, unpublished images, or proprietary results in a third-party AI service.
AI-generated images can invent structures, reverse arrows, merge biological entities, misspell labels, and imply unsupported relationships. Rebuild critical labels and symbols in an editing tool, compare every claim with the manuscript and source data, and obtain coauthor review before considering any external use.
A technically polished image can still be ineligible. Elsevier currently states that general-purpose generative AI image tools must not be used to create graphical abstracts, and individual journals may impose additional rules. Use SciFig for ideation only unless the current journal policy and editorial office explicitly permit the intended workflow.
Choose one layout pattern, describe only supported relationships, and generate a composition for human review.
Create a graphical abstract draft